
7 questions to ask before running budget scenarios
No district wants to make headlines for budget shortfalls or empty fund balances. There are serious consequences to staff, students, and communities when districts fall asleep at the wheel and find themselves blindsided by financial challenges.
Districts need their own rumble strips — quick and decisive alerts that call out potential pitfalls and draw administrators’ focus to the areas that need attention. Superintendents and CFOs should ask the following 7 questions of their data to keep their districts safely on the road to success.
- How healthy are the district’s finances?
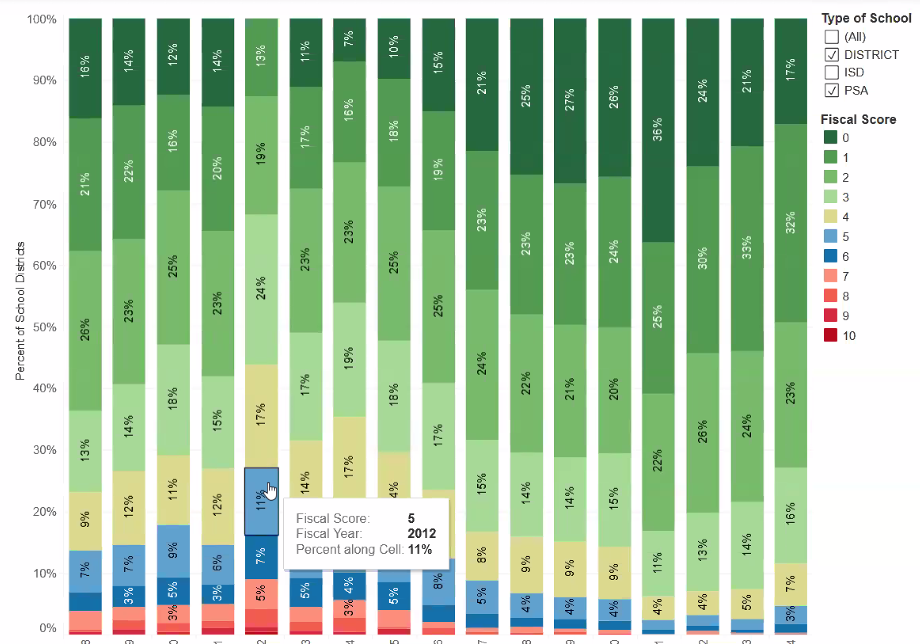
For some districts, this could be as simple as checking fund balance and debt ratios, although an aggregated indicator can offer earlier warning of negative trends. SchoolData compiles a district Fiscal Wellness Score from 10 different risk factors for a quick, top-down analysis. - Is our fund balance growing or shrinking?
Review up to 10 years of data to tell you whether a dip in your fund balance represents an anomaly or part of a long, slow drain. - How are enrollments trending?
It’s hard to make predictions about your per-pupil revenues and expenses when you can’t see the big picture. Understand how student enrollment is increasing or decreasing as a district, as well as by building or grade level. From there, districts can go on to analyze whether the trends are due to changes in the community or in student retention. - Are more students leaving or entering our district?
Student migration charts show trends in student entries and exits, as well as more granular details: in what grade do students tend to enter or leave the district? which buildings see the most migration and in which direction? Easy-to-read visuals of residency trends and demographics in the region (such as the number of school-age children) are helpful here as well. - How well are we right-sizing our staffing?
When you overlay enrollment trendlines with FTE expenditures, it’s easier to see whether staffing increases were due to organic student growth or to special programs funded by earmarked dollars. - How do our funding sources compare to a “normal” year?
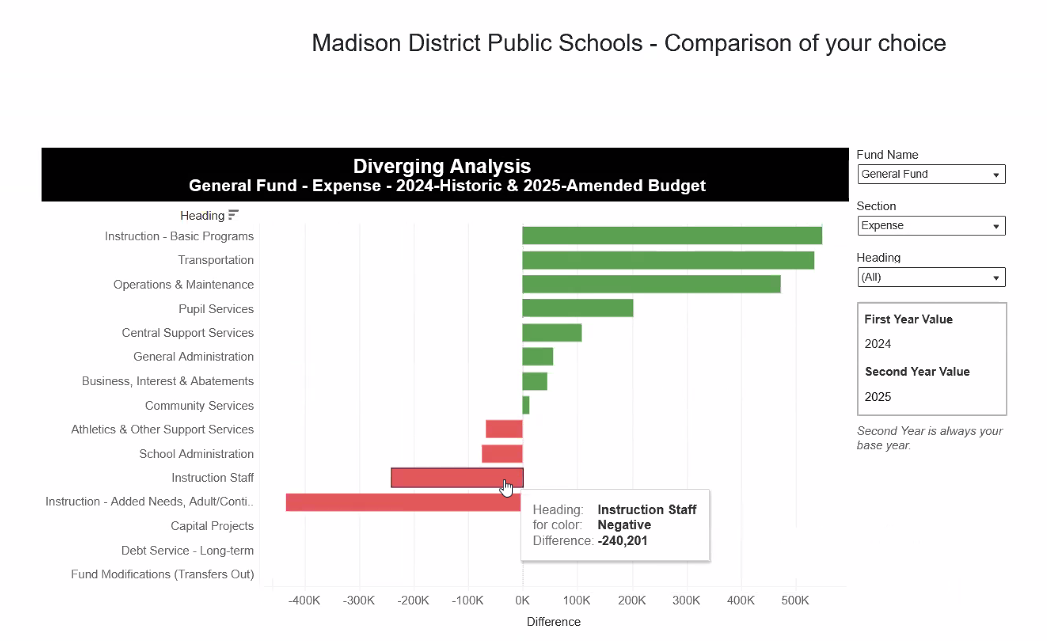
This is a great analysis to perform at times when bonds may be up for renewal or adjustments are expected to state or federal funds. Instantly see the effects of a projected change to funding using our Diverging Analysis visualization. - In which areas are we planning to spend significantly more or less than last year?
A Diverging Analysis can also be used to compare expenditures by line item. If transportation costs are increasing, for example, are those dollars being offset by savings in other areas?
While the answers provided in these data snapshots can’t tell districts precisely how to budget for the coming year, they can provide strong directional insights to drive budgeting strategy. Districts may find they need to adjust their high-level goals to accommodate overlooked gaps:
- Do we need to focus on rebuilding our fund balance?
- Are student enrollments and migration pointing to a need for more staffing or less?
- Do our planned expenditures align with our district goals?
Districts can then build a series of budget scenarios — good, better, and best — to achieve those goals, stabilize district finances, and avoid unpleasant surprises.
In our recent webinar, “Get Your District Ready: July Prep for K-12 Leaders,” Buzz Brown and Linda Kraft showed districts how to stay flexible even in uncertain times, with the high-quality data and simple visualizations needed to answer all your budget pre-check questions.
The Finance application from SchoolData is designed to provide early warning of financial distress and support creation of multiple budget scenarios. Learn more and schedule a demo here.
.png)
